
One method of how to combine different types of data – especially qualitative and quantitative, is to convert both types into belief about a given event. The previous blog posts have demonstrated how to do this using different types of quantitative data – essentially they involve working out an actual percentage of a given event occurring, given some data which doesn’t directly lend itself to doing this.
However, converting qualitative data into beliefs (or probabilities between 1 and 0 of an event occurring) is actually easier. Essentially it is just educated guess work. An easy example – expert opinion on who will win the most votes in the general election is largely – It is too close to call. A justification of that can be found in this paragraph from the Observer newspaper (see here for full article – http://www.theguardian.com/politics/2014/dec/27/2015-general-election-unpredictable-green-party-ukip:
“Political pundits are hedging their bets as never before. Their crystal balls reveal only a thick fog of uncertainty. They can agree on one thing – that it is impossible to say who will be prime minister after the election in five months’ time. “The 2015 election is the most unpredictable in living memory,” says Robert Ford, co-author of a book about the rise of Ukip, Revolt on the Right. “Past elections have been close but none has featured as many new and uncertain factors with the capacity to exert a decisive impact on the outcome.””
So, in answer to the question – will the Conservatives get the most votes – the belief is simple – 0.5, or I have no idea… there’s a 50:50 chance…
It’s easy enough to combine this (possibly not insightful, but at least honest) expert opinion with our predictions from yesterday’s opinion poll analysis using a Bayesian belief network (BBN). The following diagram (and parameterised belief network) was made in the free JavaBayes software, available here: http://www.cs.cmu.edu/~javabayes/Home/
You can download the code for the network (in XML format) here
http://www.rickstafford.com/software/basic_network.xml
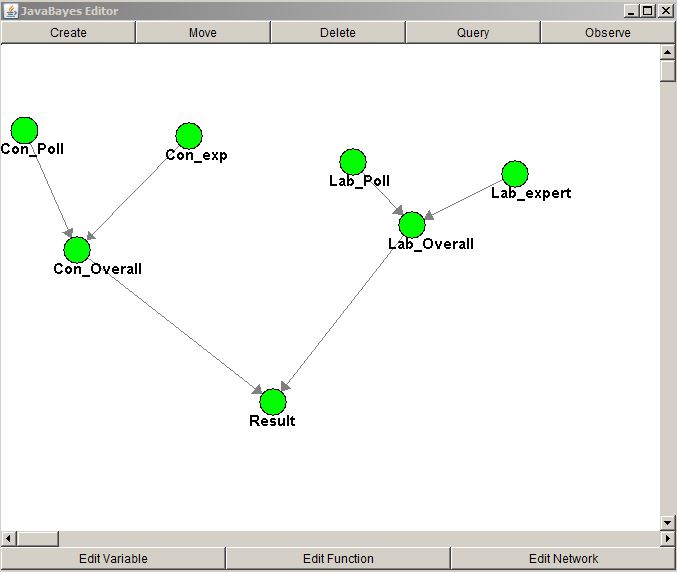
It’s not as scary as it all looks, essentially a BBN is just a way of formalising combining probabilities, although it does use the standard Bayesian equation to do so. However, the ‘Beliefs’ from yesterday’s opinion poll analysis are combined with the ‘expert’ opinion (the 50:50 split) to give an overall probability of each party winning the most votes. The final node then tells us the probability of Labour or the Conservatives having the most votes (in this case, they do add to one, as no other party is thought to be able to actually get the highest number of votes).
There are some simple functions to include here – for example, how do we weight the different types of evidence? The function is simple enough to complete, and looks like this:
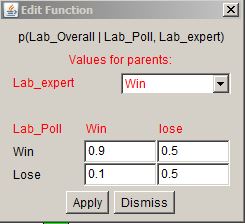
What it means is, given that the opinion poll data AND expert opinion both indicate labour is definitely winning (i.e. have values of 1) then the probability of labour winning in reality (given the election is a long time away) will be 90%. In practice, the input values (or priors, if you like) are not 1, but are 0.97 and 0.5 respectively. Combining these gives a probability of labour getting the most votes of 69%. Such an approach seems realistic – if expert opinion was absolutely certain that Labour would win, and they were even higher in the opinion polls, then even with 4 months to the election, it would seem right that we would be 90% sure of the final result. Incidentally, the odds of the Conservatives getting the most votes is 0.312 (essentially through the same parameter set) – at this point they add up to 1, but this isn’t essential at this point, as there is a final node to consider.
The final node in the BBN provides the result – the function for working this out looks like this:
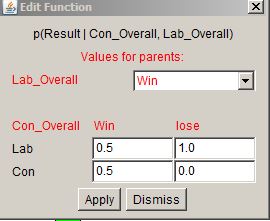
Essentially, if the node has data from the two feeding nodes that Labour win (with probability 1) and Conservatives lose (with probability 0 of winning) then it calls a Labour win. If the two nodes disagree, then it doesn’t know what to make of it. The final node here gives the following outcome:
Labour 69%, Conservatives 31% – identical to before, but this is because both sides of the network are in agreement. If they weren’t, then we’d get a different result here.
As you can see, we’ve now combined two types of data to get a better prediction of the current state of knowledge (based on data on or before 4th Jan) as to who will win the election. Why is this a better prediction? Because the opinion poll alone is a snapshot in time, and very likely to change once campaign starts. The expert opinion recognises this and moderates the results.
Next I’ll look at how to combine semi-opinion, semi-quantitative data together. The election story becomes a bit more complicated, as experts haven’t stopped at the ‘I don’t know’ stage, but have taken a more in depth analysis – and obviously football pundits have a lot to say…