
I’d like to say that I’ve delayed this post to allow for an update on the predictions of the model – but it really isn’t true, I just haven’t got around to doing it until now. However, all these predictions are made on data available to me at the start of January. Also, since I have very little knowledge of football (since I left Newcastle in 2006), I haven’t been following anything that has happened, and therefore I have an unbiased methodology (a horrible word, possibly actually used correctly here..)
So, the purpose of this work is to predict which teams will finish in the Champions’ league from the UK premiership (the top 4). I’ve already done some work, based on current points and form (see here), which is my hard quantitative data. However, things can change – there is a transfer window in January to buy new players etc. So, expert opinion might be useful too. And, in football, everyone is an expert… So ‘public opinion’ might be useful too.
The data I have are:
The previous points and form data (see here).
‘Expert’ opinion. This was actually difficult to find (as would probably always be the case), so the best I have is a summary of what players each team needs to buy in the transfer window to maximise their success (courtesy of Match magazine – 30th Dec 2014).
Given that transfers could greatly affect the team, I have then created a ‘money’ variable, which basically looks at the likelihood of being able to purchase the recommended players.
Finally, I’ve found a public survey, asking which teams will be the top 4 finishers (from quibblo.com on the 4th Jan 2015).
Of course, these data are in a wide range of forms – so how do I integrate them?
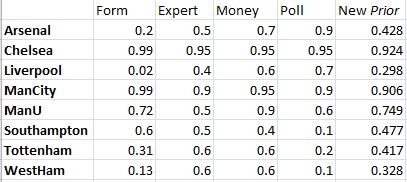
I’m going to convert each data type into a probability (between 0 and 1) of finishing in the top 4. The previous form data are already in this format.
Expert opinion. I’ve used part formula, part intuition to create this. For example, for both Man City and Chelsea, there were no specific signings recommended – however, the tone of writing (as judged by me – so, yes, slightly subjective) was more positive for Chelsea – Man City’s entry said: “..a big name transfer would be a massive boost for the players and fans”, compared to Chelsea: “we’d sign a massive star to make their squad even more unstoppable”. Both are clearly high, as no weaknesses were identified – so Chelsea get a value of 0.95, Man City = 0.9. Other than that, it was relatively simple – one player identified as vital (in a role, such as defence, striker) = 0.6, two players = 0.5, three players = 0.4.
Money. This was very subjective, and wasn’t really researched here. However, it is well known (even by me) that some teams have more money than others. Hence, this looked at the likelihood of being able to buy the players identified above – lower scores for poorer clubs and those needing more players.
Public opinion – This was largely numeric data anyway. Votes were available for each team, in this case, the highest number of votes (26) was for Chelsea – converting to 0.95 probability. Man City and Arsenal were on 22 and 23 votes resperctively -both getting probabilities of 0.9. Liverpool had 17 votes (p=0.7), Man U 14 (p=0.6), Tottenham had 5 votes (p=0.2), Southampton has 2 votes (p=0.1) and West Ham were not on the list (p=0.1 – all other teams were low, so it is likely if they were included, they would be low too). Obviously there may be bias in here – with people voting for teams they support over true opinion, but largely this is the nature of public opinion, it is bias – and it doesn’t need to necessarily be treated as equal to other data (see below).
The probabilities for each team (as well as the overall probability – prior to interactions) are shown below:
Integrating the data:
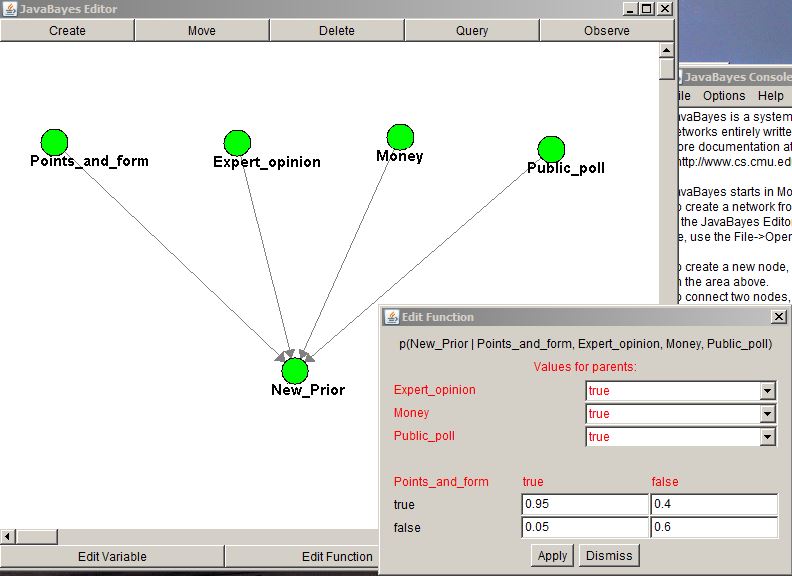
This was done by setting up a Bayesian belief network using JavaBayes (available here), in the same way as for the political data previously. In this case, all four data sets fed into a final posterior distribution (however, as this was to be used in further analysis, it was called the ‘new prior’). The nice aspect of JavaBayes here is that it becomes intuitive that some parts of the data deserve more weighting than other parts. For example, in the screen shot below, it is clear that the previous form is given more weighting than the other variables (if form suggests the team will not make the top 4 – i.e. it is FALSE, but all the other variables suggest they will make the top 4, then there is only a 0.4 probability that they will in fact make the top four (in these calculations). Full details of the probabilities used are in the XML file (here – right click and ‘Save link as’ to access) which can be loaded into JavaBayes.
Interactions between teams:
From previous form and current (at the start of January) points, we identified 8 teams which could finish in the top 4. However, there are interactions between teams – if one wins, then by default, the one they play against loses. Equally there are only 4 places in the top 4 (an obvious fact, but perhaps one that needs stating…). So, if one team are in the top 4, then this means the chances of others getting there are decreased.
Incorporating reciprocal interactions in Bayesian networks is difficult statistically, and as such not really done in an intuitive manner by most BBN software. However, it is quite easy computationally (see here for details). This Excel file, with associated VBA code, runs reciprocal interactions – how it works can probably be followed from this paper. In this case, the interaction probabilities (the third tab of the worksheet) are key. It is obvious from the data above that Man City and Chelsea will be extremely unlikely to finish outside the top 4. Hence, really the competition is for the remaining two places. Hence interaction strengths between teams and either Chelsea of Man City are weaker than for the others (closer to 0.5, meaning equal chance of being or not being in the top 4).
Running the simulation produces the following predictions:
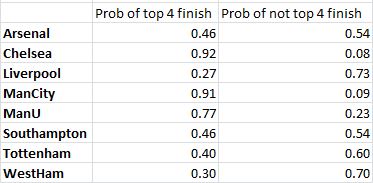
So, top 4 finishes likely for Chelsea, Man City and Man U. The final place is equally likely to be either Southampton or Arsenal (based on predictions and data from the start of 2015).
The current (24th Feb) positions are (and yes, this is my first look at this, since early Jan):

So, these really are looking pretty good at the moment.